A Toolkit Use for Laboratory: Enhancing Teaching Through Data Collection and Visualization
Embedded Systems
Modern education thrives on the integration of technology, and data collection and visualization toolkits have become pivotal in this transformation. These toolkits empower educators to bring theory to life, enabling students to explore concepts through real-time experiments and interactive graphics.
In this blog, we’ll explore what these toolkits are, their practical applications in education, and why they are a game-changer in modern laboratories.
1. What is a Laboratory Toolkit for Data Collection and Visualization?
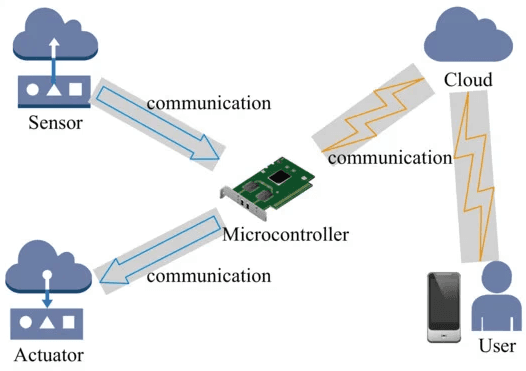
A laboratory toolkit for data collection and visualization consists of hardware and software designed to:
Collect data from sensors, instruments, or other input devices.
Visualize data through charts, graphs, or animations in real time.
Analyze and interpret data, providing actionable insights.
Typical Components of the Toolkit:
Sensors: Devices measuring variables like temperature, pressure, light, or humidity.
Data Collection Hardware: Microcontrollers like Arduino or Raspberry Pi.
Visualization Software: Tools such as MATLAB, Python libraries (Matplotlib, Seaborn), or proprietary applications like Logger Pro.
2. Applications of the Toolkit in Education
2.1. In Science Subjects
Physics:
Conduct experiments on motion, electricity, or thermodynamics, and represent findings visually.
Example: Using a motion sensor to plot velocity vs. time graphs.
Chemistry:
Track chemical reactions by measuring changes in temperature or gas pressure over time.
Example: Observing reaction rates using pressure sensors.
Biology:
Monitor environmental factors such as soil moisture or CO2 concentration in ecosystems.
Example: Studying photosynthesis using light intensity and CO2 sensors.
2.2. In Mathematics and Data Analysis
Visualize equations and functions in dynamic, interactive ways.
Teach students how to process real-world datasets and apply statistical methods.
2.3. In Computer Science and Engineering
Introduce students to programming and hardware integration through projects.
Example: Building IoT devices that collect and display environmental data.
3. Key Benefits of Using the Toolkit
3.1. Engages Students with Hands-On Learning
Encourages students to actively participate in experiments rather than passively consuming information.
3.2. Improves Understanding Through Visualization
Makes abstract concepts tangible by showing real-time graphical representations of data.
3.3. Builds Technological and Analytical Skills
Introduces students to modern tools and techniques relevant in scientific and technological careers.
4. Popular Toolkits for Educational Laboratories
Vernier Logger Pro
Comes with a wide variety of sensors and a robust visualization platform.
Arduino and Raspberry Pi
Affordable, versatile, and ideal for custom projects involving sensors and actuators.
LabQuest 2
A portable device for collecting and visualizing data, designed specifically for classroom use.
5. Examples of Use in the Classroom
Experiment: Measuring Water Temperature Over Time
Setup: Connect a temperature sensor to a data logger.
Goal: Analyze how heat transfer occurs when water is heated or cooled.
Outcome: Generate a temperature vs. time graph for interpretation.
Experiment: Light Intensity and Photosynthesis
Setup: Use a light sensor and a CO2 sensor to study photosynthesis rates under varying light conditions.
Outcome: Create graphs showing correlations between light intensity and CO2 absorption.
6. Challenges and Solutions
Challenge 1: Cost of Equipment
Solution: Use cost-effective tools like Arduino or open-source software to reduce expenses.
Challenge 2: Lack of Technical Skills
Solution: Provide training workshops for educators and introductory sessions for students.
Challenge 3: Limited Access to Resources
Solution: Create shareable setups or virtual labs for remote students.
Conclusion
Data collection and visualization toolkits are revolutionizing how science and technology are taught. By making data tangible and interactive, they foster curiosity, critical thinking, and technological proficiency among students. If you’re an educator or student, consider integrating these tools to transform the learning experience in your laboratory.
Have questions or want to share your experiences with these toolkits? Drop a comment below!


Am I Suitable ?
I would love to collaborate with you! Whether it is launching something new or improving what you already have, I’m here to help transform your vision into a successful reality.
Let’s make it happen!
Have a nice day!
Thanks for visiting my house!
Contact
Ritaniemenkatu, Lahti 15240, Finland
(+358) 46 583 3980